How to Monitor and Optimize Validator Node Performance Across Ethereum, Solana, BNB Chain, and TRON
By CAVI Team · 2026-10-02
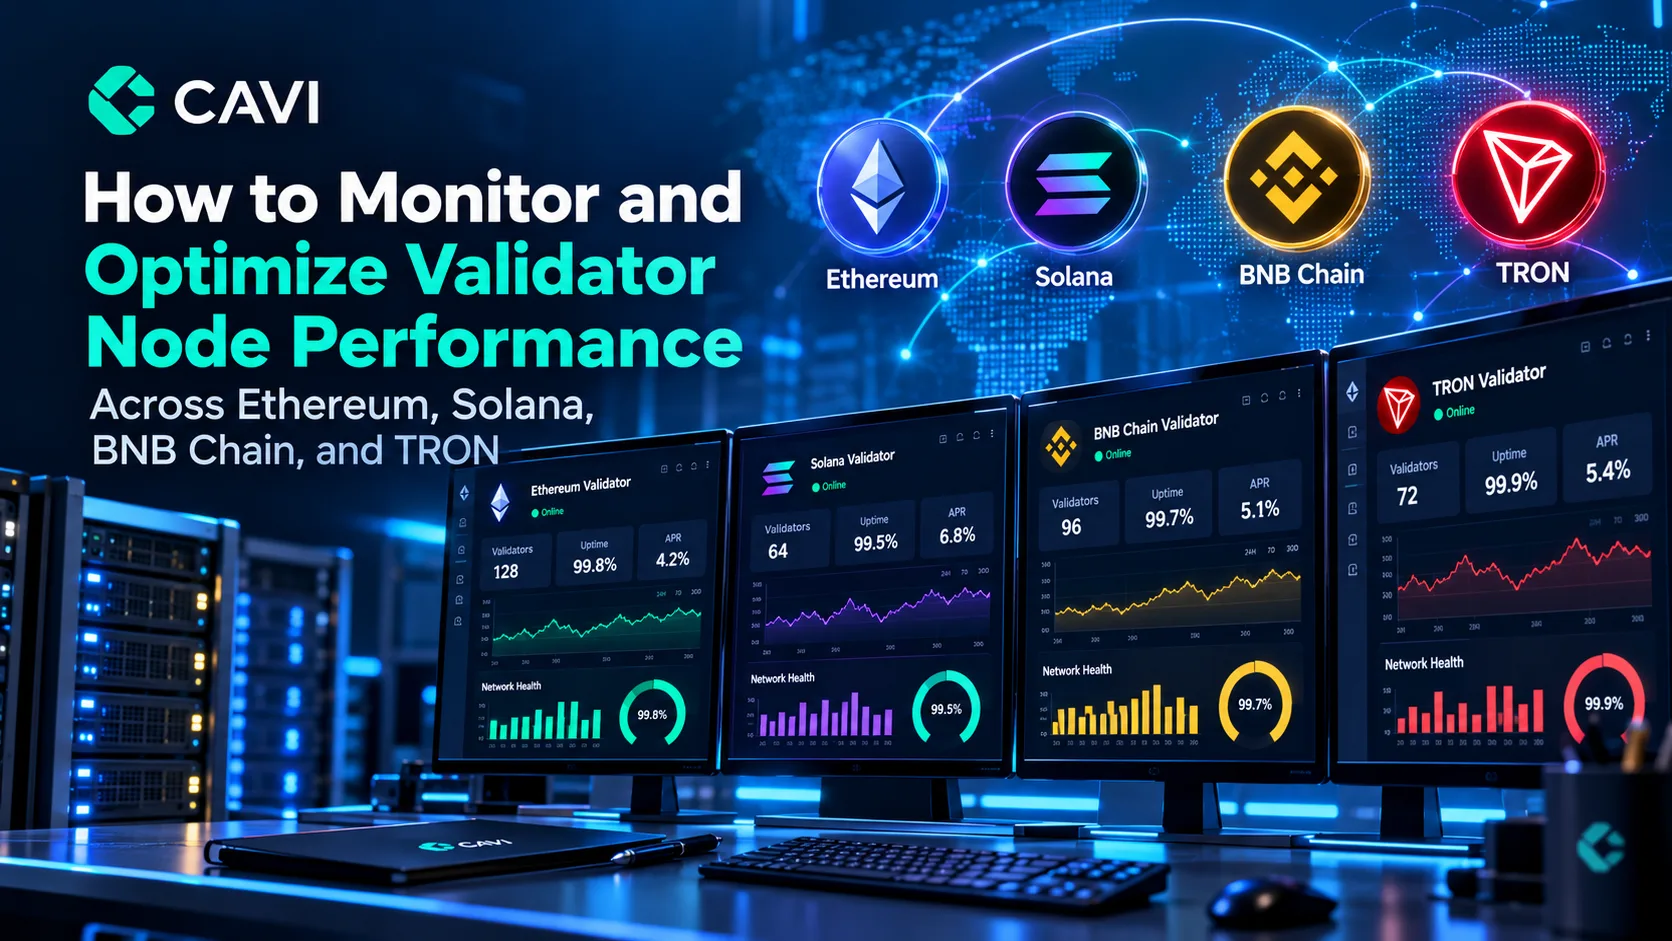
Introduction
Running a validator node is the backbone of proof‑of‑stake (PoS) networks, but the rewards you earn are only as good as the uptime and reliability you maintain. Whether you’re staking on Ethereum, Solana, BNB Chain, or TRON, a lapse in performance can mean missed rewards, lower APY, or even slashing penalties. This guide walks you through the essential monitoring tools, the most important metrics for each chain, and practical optimization tips so you can keep your node humming and your rewards growing. We’ll also show where CAVI—our multi‑chain validator‑as‑a‑service platform—fits into a robust monitoring workflow.
Why Real‑Time Monitoring Matters
- Reward maximization – Most PoS protocols distribute rewards proportionally to participation. A validator that misses blocks or votes loses a share of the daily reward pool. For example, Ethereum’s staking rewards have historically hovered around 3‑5% APR (source: ethereum.org).
- Slashing prevention – Chains like Ethereum, Solana, and BNB Chain impose penalties for double‑signing or prolonged downtime. Even a single slash can erase several percent of your staked capital.
- Network health – Your node’s performance contributes to overall network security. Consistently high‑performing validators help keep transaction finality low and fees predictable.
Pro tip: If you already use CAVI, the platform’s Figment‑grade infrastructure automatically feeds health metrics into a unified dashboard, letting you focus on fine‑tuning rather than basic uptime checks.
Core Metrics Across All Chains
| Metric | Why It Matters | Typical Range (Healthy Node) |
|---|---|---|
| Uptime / Liveness | Determines eligibility for rewards and slashing risk. | > 99.9% (Ethereum, BNB Chain) – > 98% (Solana) – > 95% (TRON) |
| Block / Slot Production | Directly tied to reward distribution. | 95‑100% of assigned slots (Solana) – 99‑100% attestations (Ethereum) |
| Participation Rate | Percentage of consensus opportunities the validator answered. | > 99% for most PoS networks |
| Effective Balance / Stake Weight | Impacts proposer priority and reward share. | Consistently reflects your self‑stake + delegated stake |
| Network Latency | High latency can cause missed votes. | < 100 ms to majority of peers |
| Penalty / Slashing Counter | Tracks any infractions. | Zero for a well‑run node |
Understanding these metrics is the first step; the next is gathering them in real time.
Setting Up Real‑Time Monitoring
1. Ethereum (Beacon Chain)
- Beacon Chain API – The official API (e.g.,
https://beaconcha.in/api/v1) provides validator balances, attestation effectiveness, and proposer duties. Use endpoints like/validator/{pubkey}/performanceto pull daily uptime. - Prometheus + Grafana – Exporter projects such as eth2‑metrics-exporter scrape the API and expose Prometheus metrics. Grafana dashboards (pre‑built on the Grafana Hub) visualize uptime, sync status, and slashing risk.
- Etherscan Alerts – Set up email or webhook alerts for missed blocks via the Etherscan “Validator Alerts” page.
External reference: Ethereum’s official staking documentation outlines the importance of uptime and provides the API spec (ethereum.org).
2. Solana
- Solscan – A community‑trusted explorer that shows validator uptime, vote account health, and stake composition. The “Validator Health” tab aggregates block production and voting performance (Solscan blog).
- JSON‑RPC Polling – As detailed by OnFinality, you can infer uptime by repeatedly calling
getVoteAccounts,getSlot, andgetBlockProductionagainst a reliable RPC endpoint and tracking changes over time (OnFinality guide). - SolWipe & SolanaCompass – Both provide optimization checklists and performance dashboards. SolWipe’s blog highlights hardware tuning and network stack tweaks for better block production (SolWipe).
3. BNB Chain (Beacon Chain)
- BSC Scan Validator Dashboard – Similar to Etherscan, BSC Scan lists validator uptime, missed proposals, and total stake. Set up “Watchlist” alerts for any drop in performance.
- Beacon Chain Explorer – The BNB Chain Beacon Chain explorer (
https://beaconcha.in/) offers a unified API for validator performance metrics, mirroring Ethereum’s endpoints. - Grafana Templates – Community‑contributed dashboards for BNB Chain can be imported directly, feeding data from the same Prometheus exporter used for Ethereum.
4. TRON
- TRONSCAN – The official explorer provides a “Validator” page showing block production rate, missed blocks, and voting power. While TRON does not expose a public Prometheus exporter, you can pull data via the TRON‑Grid API (
https://api.trongrid.io/v1/accounts/{address}) and compute uptime. - Custom Scripts – Simple Python scripts that call
getBlockByNumberand compare timestamps can flag latency spikes.
Building a Unified Multi‑Chain Dashboard
The ChainScore Guides tutorial demonstrates how to aggregate on‑chain data from multiple PoS networks into a single Grafana view (ChainScore guide). Follow these steps:
- Collect data – Deploy Prometheus exporters for Ethereum and BNB Chain; use scheduled scripts for Solana and TRON to push JSON to a Pushgateway.
- Normalize metrics – Map chain‑specific fields to the core metrics table above (e.g.,
attestation_success_rate→Participation Rate). - Create panels – Use Grafana’s “Stat” panel for uptime, “Heatmap” for latency, and “Bar gauge” for reward per epoch.
- Set alerts – Define thresholds (e.g., uptime < 99.5% for 5 min) and route them to Slack, Discord, or email.
- Add CAVI overlay – If you run validators through CAVI, enable the CAVI Performance API (available in your dashboard settings) to overlay Figment‑grade health metrics without extra scripting.
Fine‑Tuning Your Validator per Chain
Ethereum
- Client choice – Lighthouse, Prysm, and Teku have slightly different CPU/memory footprints. Lighthouse typically uses less RAM, which can improve sync speed on modest hardware.
- Network stack – Use a dedicated Ethernet NIC and enable TCP fast open. A latency under 50 ms to the majority of peers is recommended.
- Sync mode – Run in “fast sync” only during initial setup; switch to “full sync” for production to avoid re‑orgs.
Solana
- Hardware – SSDs with at least 1 TB NVMe and 32 GB RAM are the baseline; many top validators run 64 GB RAM for better slot processing (SolWipe).
- Vote account configuration – Keep the vote account’s
commissionlow (e.g., 5‑10%) to stay competitive while still covering operational costs. - RPC redundancy – Deploy two RPC endpoints (one local, one cloud‑based) to avoid single‑point failures.
BNB Chain
- Beacon client – Use the official BNB Chain client (
bnbchain-go) and keep it updated with the latest hard‑fork patches. - Gas price monitoring – Adjust your proposer fee to stay within the optimal range (usually 5‑10 gwei) to avoid missing proposal slots.
TRON
- Block production window – TRON’s 3‑second block time means your node must respond quickly. Optimize the Java Virtual Machine (JVM) heap size (e.g.,
-Xmx8g) and enable G1GC for low pause times. - Peer selection – Prefer peers with low ping and high bandwidth; prune stale connections weekly.
Automated Alerts & Remediation
| Alert Type | Trigger Condition | Suggested Action |
|---|---|---|
| Uptime dip | < 99.5% for 10 min | Restart validator client, check logs, verify network connectivity |
| Missed slots | > 2 missed slots in a 5‑minute window (Solana) | Scale up CPU cores or move to a higher‑performance VM |
| Slashing flag | Any slash event reported by API | Immediately pause staking, investigate double‑sign evidence, contact support |
| Latency spike | Avg. peer latency > 150 ms | Switch to a closer data‑center or add a secondary ISP line |
Most monitoring stacks (Prometheus + Alertmanager) support webhook integration with CAVI’s incident response channel, allowing you to create a single ticket that triggers automated failover to a backup node.
Minimizing Slashing Risk
Slashing rules differ across chains, but the core principle is the same: avoid double‑signing and maintain consistent uptime. For a deeper dive into chain‑specific penalties, read our article on slashing risks (Slashing Risks Across Ethereum, Solana, and BNB Chain).
- Ethereum – Slashing occurs for double‑signing or being offline for > 2 epochs. The penalty is ~0.5% of the validator’s balance per offense.
- Solana – Missed votes incur a small “vote credit” reduction; repeated offenses can lead to a 2‑5% stake reduction.
- BNB Chain – Similar to Ethereum, with a 0.5‑1% slash for double‑signing.
- TRON – Currently, TRON applies a “missed block” penalty rather than a direct slash, but prolonged downtime reduces voting power.
Best practice: Keep your client software up‑to‑date, enable automatic restarts on crash, and use a geographically redundant node pair.
How CAVI Simplifies Monitoring
CAVI’s platform provides:
- Figment‑grade infrastructure – High‑availability nodes pre‑configured with the latest client versions.
- Built‑in dashboards – Real‑time charts for uptime, rewards, and slashing risk across all four supported chains.
- One‑click alerts – Configure threshold‑based notifications directly from the CAVI UI.
- Automatic re‑delegation – If a validator dips below performance thresholds, CAVI can rebalance your stake to a healthier node, protecting your rewards.
By leveraging CAVI, even a non‑technical staker can benefit from enterprise‑grade monitoring without maintaining their own hardware.
What the Community Says
- Reddit discussion: The r/ethstaker community frequently shares monitoring scripts and Grafana dashboards. A recent thread highlighted the importance of using the Beacon Chain API for early detection of missed attestations (reddit.com/r/ethstaker).
- Solana validators on r/solana discuss the trade‑offs between low‑commission and high‑performance setups, often pointing to Solscan as their go‑to health checker (reddit.com/r/solana).
- Twitter chatter: A quick search for
#stakingshows dozens of validators posting uptime screenshots and alerting followers to upcoming network upgrades that could affect performance (X search).
These community insights reinforce the need for continuous monitoring and proactive optimization.
Conclusion
Effective validator monitoring is not a “set‑and‑forget” task—it requires real‑time data, alerts, and regular tuning. By leveraging chain‑specific tools like Solscan, Beacon Chain API, and TRONSCAN, and by unifying the data in a Grafana dashboard (guided by ChainScore), you can keep uptime above 99.9% and safeguard against slashing across Ethereum, Solana, BNB Chain, and TRON. For those who prefer a managed experience, CAVI delivers Figment‑grade performance monitoring out of the box, letting you focus on strategic staking decisions rather than server maintenance.
Stay vigilant, keep your software updated, and let the data guide your optimization—your rewards (and peace of mind) will thank you.
Further Reading
- Diversifying Your Crypto Staking Portfolio
- Liquid Staking Explained
- How Network Upgrades Impact Staking Rewards
- Is Validator Staking Safe?
Prepared by the CAVI editorial team – your trusted source for multi‑chain staking insights.